 Net Wealth by Race
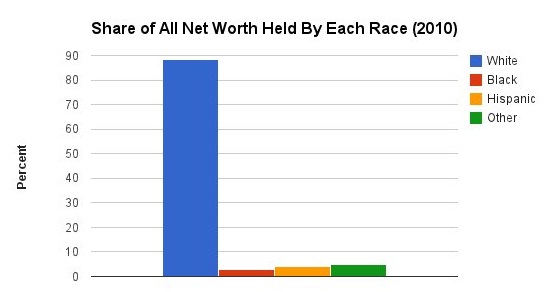
The above chart, which was created by Matt Bruenig of Demos using 2010 data, breaks down wealth in the U.S. by race. The chart indicates that while white Americans make up only 64 percent of the country’s population, they possess more than 88 percent of its wealth.
Median Household Income Gap
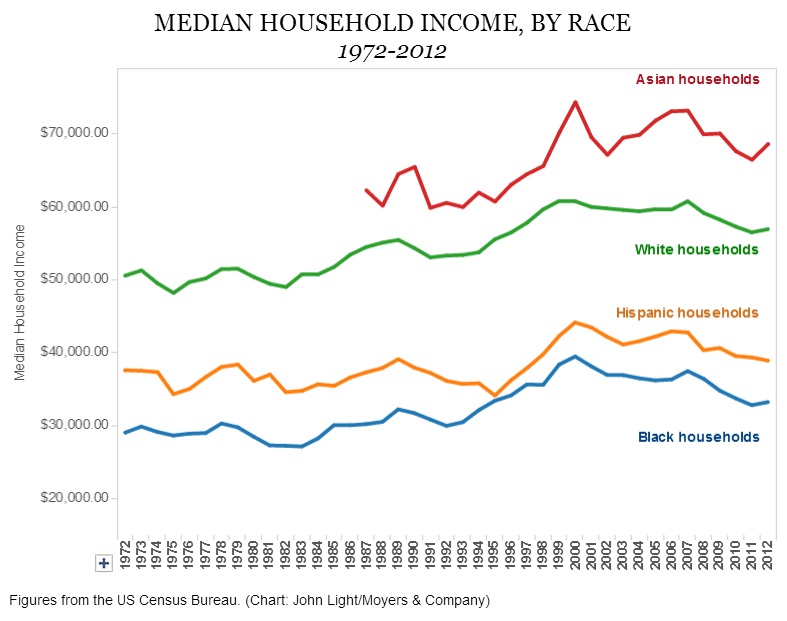
For the last few decades, the large disparity between African-Americans’ median household income and that of whites has mostly stayed the same. The comparatively low incomes of Black households are made worse by the fact that across all races, most Americans are making less today than they were in 2000.
Independent journalism still matters.
We hope this story was worth your time. For over 14 years, Atlanta Black Star has stayed Black-owned and independently run. We didn't get here by waiting on ad budgets that were never built to prioritize us. Our readers did that.
Corporate support for Black media has always been thin. Outlets like ours get roughly 1% of the $170 billion spent on U.S. advertising each year, and that margin is shrinking further as advertisers walk back the DEI-linked commitments they made in 2020. That's the backdrop. It's not why we're asking.
The wider picture isn't any steadier. Newspaper ad revenue has fallen more than 80% since 2005, and local newsrooms are closing at a rate of roughly two a week nationwide. When outlets go under, it's rarely the ones built to center a Black perspective from the ground up that get to stick around.
We know a request for support isn't why you came here. But without readers choosing to fund this work directly, the depth of reporting we can do at home and abroad shrinks along with everyone else's. If you're not in a position to give, that doesn't change how much we value you as a reader.
If you are able to, a recurring contribution does more for us than a single one-time gift, because it lets us plan the next investigation instead of just the next invoice. It takes about 30 seconds, no long form, no account. Thank you for continuing to support independent journalism and freedom of the press.