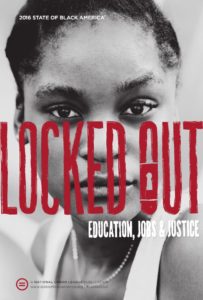
The 2016 State of Black America report. Courtesy National Urban League.
The National Urban League released its 2016 State of Black America report Tuesday. The verdict: Not much has changed in the last 40 years.
“Locked Out: Education, Jobs and Justice” reflects on the discouraging parallels between African-American life in 1976, when the semiannual publication launched its first edition, and life for Black people in today’s world.
In 1976, the U.S. was emerging from an oil crisis that left the economy at its lowest point since the Great Depression. Members of the Organization of Arab Petroleum Exporting Countries declared an oil embargo in October 1973, in protest of Israeli occupation in the Arab nations. The stock markets crashed, inflation and unemployment rates skyrocketed and Black people, as usual, were disproportionately impacted by the downturn.
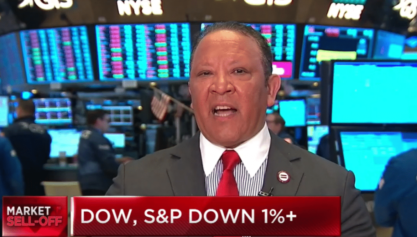
“Since 1976, the Black unemployment rate has consistently remained about twice that of the white rate across time, regardless of educational attainment,” National Urban League CEO and President Marc Morial wrote in the opening notes. “The household income gap remains at about 60 cents for every dollar. Black Americans are only slightly less likely today to live in poverty than they were in 1976.”
Morial went on to highlight a quote from then-National Urban League Director Vernon Jordan’s notes about the absence of Blacks in law enforcement that year.
‘The City of Chicago is an example: with a population that is 32.7 percent black, it has a police force that is only 16 percent black, ‘ Jordan wrote in 1976.
Morial referred to the 2007 Bureau of Justice Statistics survey, which found that the percentage of white officers in police forces around the country is over 30 percentage points higher than in the communities they serve.
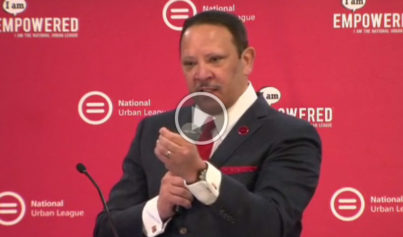
“We are now, as we were then, a nation struggling to overcome the worst economic downturn since the Great Depression. All gears have been thrown into reverse,” Morial said at the league’s official release at the Newseum in Washington, D.C. “We are now, as we were then, facing growing pressure to slash human needs programs for the poor, who are demonized and characterized as lazy slackers trying to cheat the system.”
Some issues have taken a turn for the worse in the last 40 years. The Black home ownership rate was 43.7 percent in 1976. Now, it is down to just 43 percent. A small decrease but significant when considering the improvements made in education attainment, the report notes. Forty years ago, 6.6 percent of African-Americans had a Bachelor’s degree or higher. In 2016, 22.2 percent of Blacks hold the post-secondary degree.
The SOBA report also took a critical look at President Barack Obama’s legacy and the impact his historical win has had on Blacks in America.
“As President Obama wraps up his final months as the nation’s first African-American commander in chief, we begin to assess the progress Black America has made under his administration,” Morial wrote in the report. “How well has the nation recovered from the worst economic crisis it has seen in generations? How much closer are we to the very important goal of universal healthcare coverage has the Affordable Care Act — Obamacare — gotten us?”
Morial said this year’s Equality Index indicates that the presidency has not served as a cure-all for the nation’s race problem.
The Equality Index, based on data gathered by IHS Global Insight, is the tool used by the League to track racial equality in America. It measures on a scale of 1 to 100, how close Blacks and whites are from achieving total equality in the areas of economics, health, education, social justice and civic engagement.
In 2016, the overall Equality Index was 72.2, up from 72 in 2015. There were increases in some areas. For example, economics rose from 55.5 to 56.2, and social justice from 60.6 to 60.8. Education saw the biggest increase from 76.1 to 77.4, which the report attributes to advancements in college attainment and enrollment.
“The increase in the economics index came primarily through progress in closing the digital divide as well as lower denial rates for African Americans seeking mortgage and home improvement loans. The unemployment and homeownership gaps remained unchanged from the previous year,” the report states.
“The improvements in the social justice index resulted from a decline in the black incarceration rate, while the percent of whites placed in prison following an arrest grew by more than the rate for blacks.”
Health and civic engagement indices declined, however, health slightly by .2 percent (79.6 to 79.4) and civic engagement drastically by 3.4 percent (104 to 100.6). The large decrease is typical in mid-term election years, according to the report.
The 2016 State of Black America report concludes with an enlightening retrospective and Then & Now data table, charting the similarities between 1976 and 2016. Some highlights:
Education:
“…roughly one-third of 18-24 year-olds are enrolled in college. While whites have increased college enrollment faster than Blacks between 1976 and 2014 (most recent data available), the college completion gap has narrowed 20 percentage points over this time (from 43% in 1976 to 63% in 2014).”
Poverty:
“On the other hand, there has been slow, but ongoing progress in reducing poverty, in spite of the economic challenges presented by the Great Recession. According to the most recent estimates, the Black poverty rate is now 2.4 percentage points lower than in 1976 (down to 27% from 29.4%).”
Civic Engagement:
“While the percentages of Blacks and whites who actually voted in the last election are both much lower than the percentages in 1976, this is partly due to the fact that these data are comparing a presidential election year (1976) with a non-presidential election year (2014). However, even with this decline in participation, that gap between Blacks and whites has narrowed seven percentage points, suggesting that Black civic engagement has declined by less than that of whites.”

