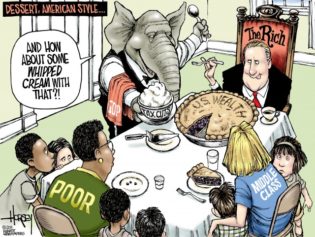
Last year the income gap between the rich and everybody else in the U.S. was at its widest in nearly 100 years, as the top 1 percent of earners pulled in 19.3 percent of the nation’s total household income, according to a new analysis by researchers at the University of California, Berkeley and the Paris School of Economics at Oxford University.
Not since 1927, at the height of the roaring ’20s —and just before the stock market crash of 1929—have the richest Americans claimed such a large a slice of total American wealth, based on data from the Internal Revenue Service.
While the pretax incomes of the top 1 percent rose 19.6 percent last year, the income for the other 99 percent rose just 1 percent. It was a perfect illustration of the thinking behind the “Occupy” demonstrations waged across the country in 2011, to protest the rising income inequality in the U.S, which has widened over the past three decades.
According to the analysis, the top 10 percent of richest households represented just under half of all income in 2012.
The top 1 percent of American households had income above $394,000, while the top 10 percent had income exceeding $114,000.
Emmanuel Saez at the University of California, Berkeley, one of the economists who analyzed the tax data, offered a possible reason for the rise: widespread sales of stock by the wealthy to avoid higher capital gains taxes in January.
While the government instituted policy changes aimed at reducing income inequality after the Great Depression, Saez wrote that the measures being undertaken now are small in comparison.
“Therefore, it seems unlikely that U.S. income concentration will fall much in the coming years,” he wrote.
During the Great Recession, incomes among the richest fell more than 36 percent between 2007-09, compared with a decrease of 11.6 percent for the rest of Americans. But they more than made up for it in the last three years, when 95 percent of all income gains have gone to the richest 1 percent.

